There are two ways to make calculated expressions available to users. One option is to save the calculation formula as a custom output point.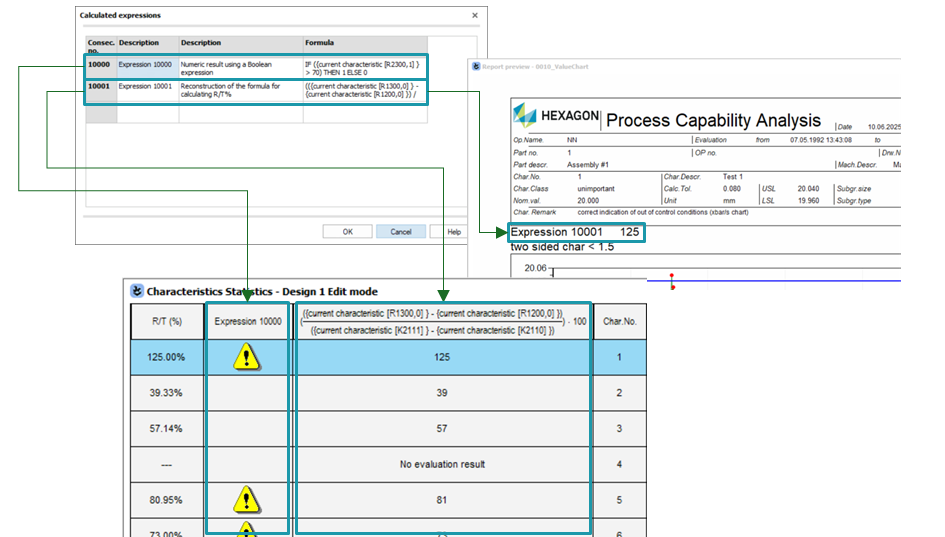
The second option is to save the calculation formula as an element in a report.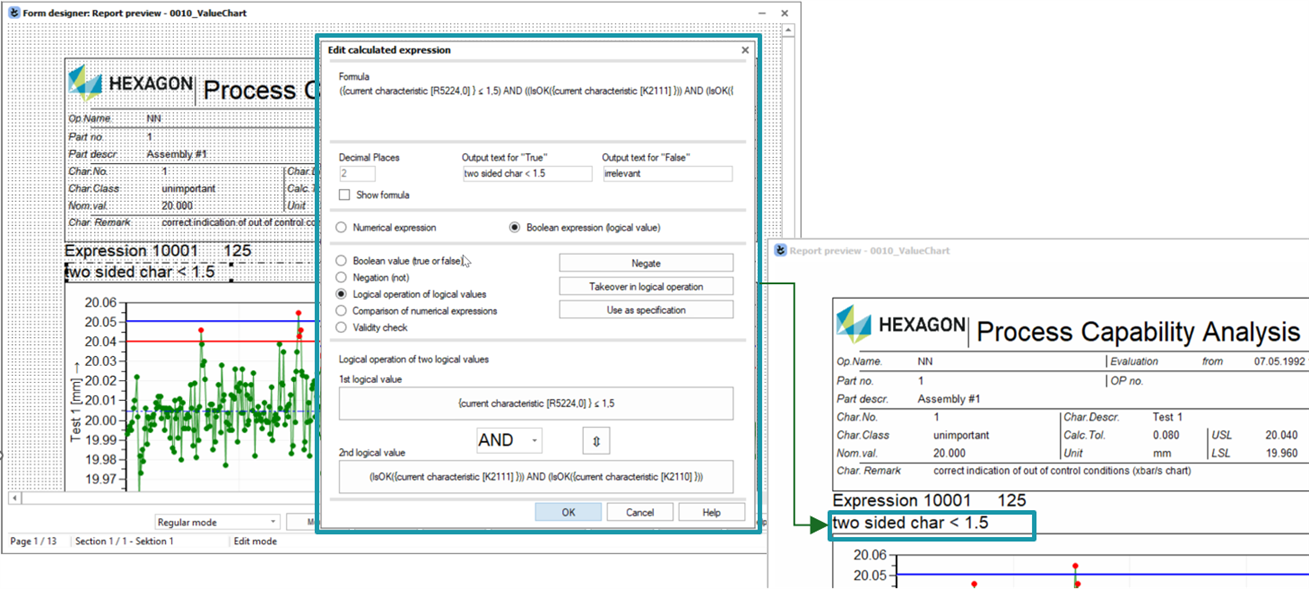
An explanation of the pros and cons of each method is available in a separate topic. Link to: Ways to manage the calculated expressions
Table of Contents
Custom output points in general
The loaded data pool is automatically evaluated in the Q-DAS applications according to the set evaluation strategy. The information from the data pool and the results calculated during the evaluation are available in the application as output points.
In the Q-DAS applications, output points are offered for different types of information. This could be, for example, information on K-field contents, result fields, various evaluations, predefined text modules or graphics. If, for example, a result is required in a graphic or on a report, only the corresponding output point must be included in the graphic or the report.
The output points are selected via the dialogue "Output field selection (listing)". The output points listed in the dialogue are already summarised according to the type of information.
Custom output points have their own “Calculated Output (10000-10xxx)” subgroup within the “Output Combination Fields” group.
<Output field selection (listing)> | <Output combination fields> | <Calculated output (10000-10xxx)>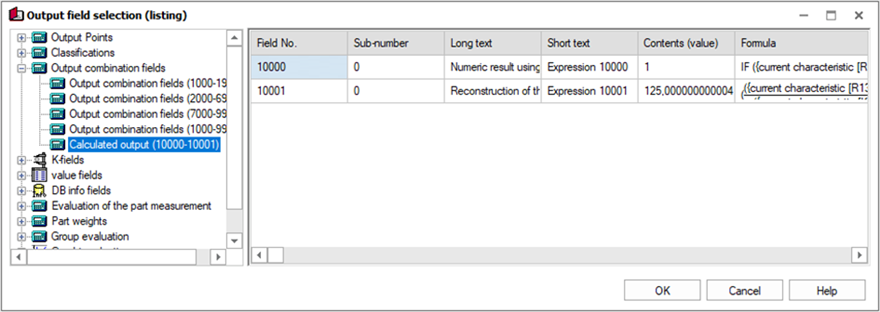
Basic information on configuring output points can be found in separate documentation. Link to: Q-DAS Graphics - General Configuration - Configure output points
Custom output points in Q-DAS graphics
As it is not possible to integrate the measured value information, custom output points can only be added to graphics that display characteristics and part information. This mainly applies to the lists and the table graphic in the “Results” tab of the ribbon bar.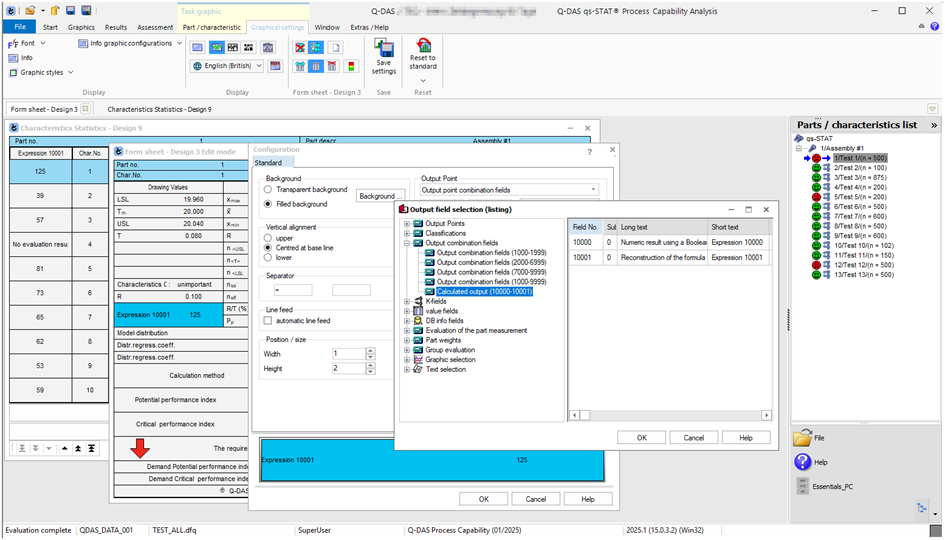
The following provides an overview of the necessary steps. Further details can be found via the provided links.
| 1 | Create custom output point. Link to: Calculated Expressions |
| 2 | Load the required Q-DAS graphic and activate the “Edit Mode”. Link to: Q-DAS Graphics - General Configuration - Edit mode |
| 3 | Add a new element to the graphic or edit an existing one. Then, select the required custom output points via the "Output field selection (listing)" dialogue. Configure the output point to display the required information. Link to: Q-DAS Graphics - General Configuration - Configure output points |
Custom output points in reports
In the Form designer (Q-FD), the required custom output point can be added using drag and drop, i.e. by dragging the element from the “Output field selection (listing)” and dropping it into the drawing area of the Form designer (Q-FD).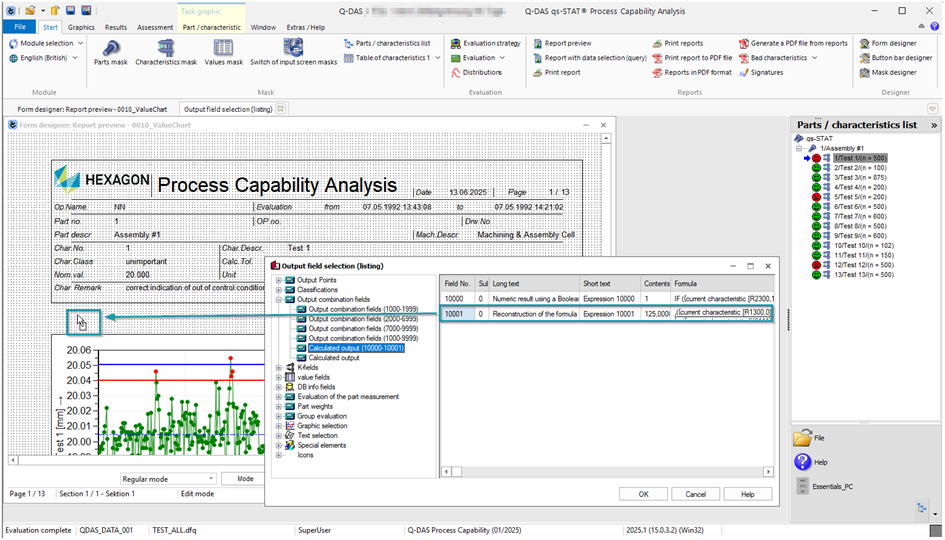
The following provides an overview of the necessary steps. Further details can be found via the provided links.
| 1 | Create custom output point Link to: Calculated Expressions |
| 2 | Load an existing report or create a new one using Form designer (Q-FD). Link to: Q-FD - Basic handling |
| 3 | Configure the output point to display the required information. Link to: Q-DAS Graphics - General Configuration - Configure output points |
Allocating symbols to custom output points
Symbol allocation allows a fixed symbol or a content-dependent symbol to be allocated to an output point such as K-fields, result fields or custom output point. When a custom output point was created using calculated expression, the result can be output as symbol in Q-DAS graphics or reports.
Once the symbol allocation is configured for a custom output point the “Configurable symbol” is available in the output form list.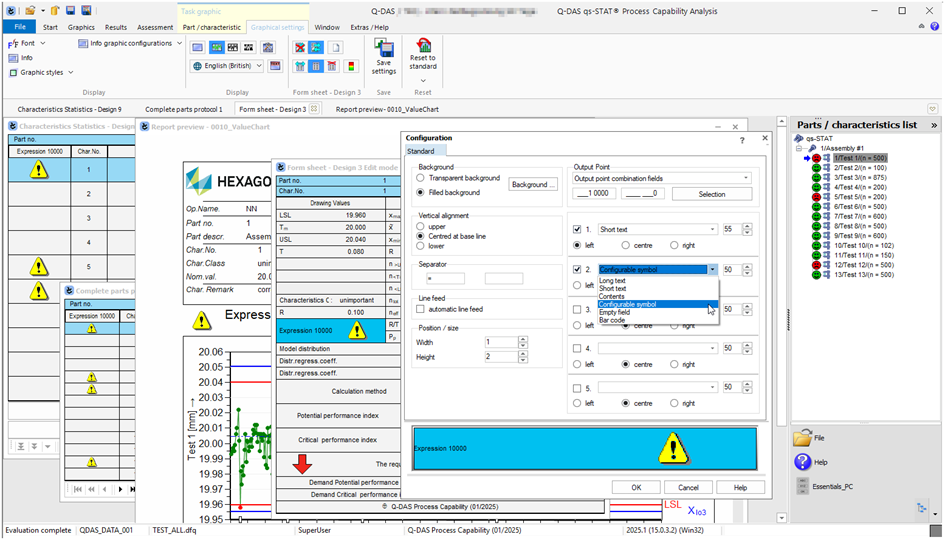
The following provides an overview of the necessary steps. Further details can be found via the provided links.
| 1 | Create custom output point. Link to: Calculated Expressions |
| 2 | Configure the symbol allocation for the required custom output point. Link to: General Settings Dialogue - Symbol allocation |
| 3 | Load the required Q-DAS graphic or report to add or change the output point. Link to: Q-DAS Graphics - General Configuration - Edit mode (Graphics) Link to: Q-FD - Basic handling (Reports) |
| 4 | To output the configured symbol, select the “Configurable symbol” output form for the required custom output point. Link to: Q-DAS Graphics - General Configuration - Configure output points |
Calculated Expressions in Reports
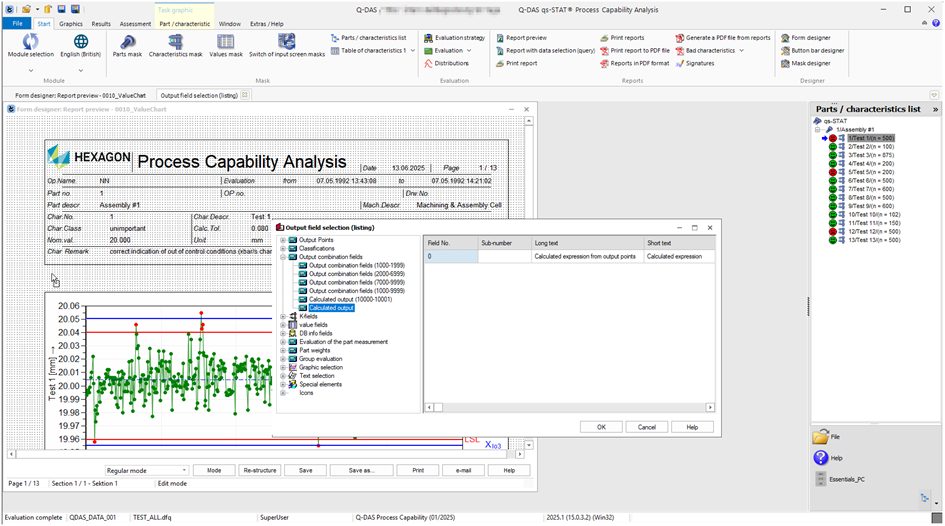
In the Form designer (Q-FD), the new element for calculated expressions can be added using drag and drop, i.e. by dragging the element from the “Output field selection (listing)” and dropping it into the drawing area of the Form designer (Q-FD).
<Output field selection (listing)> | <Output combination fields> | <Calculated output>
To add the calculated expression, select the "Calculated expression" option from the context menu.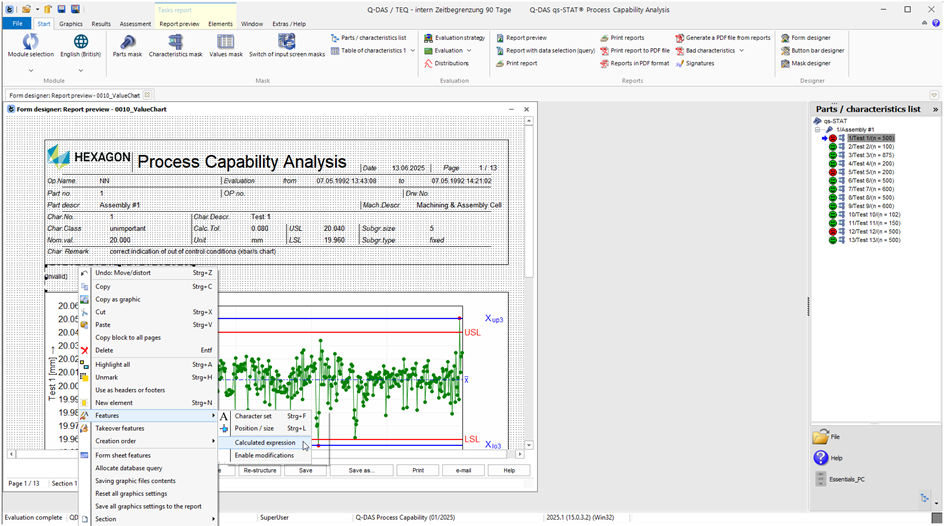
Use the "Edit calculate expression" dialogue to assign a calculated expression to this element. This calculated expression will be saved with the report and will only be available for this particular report and element.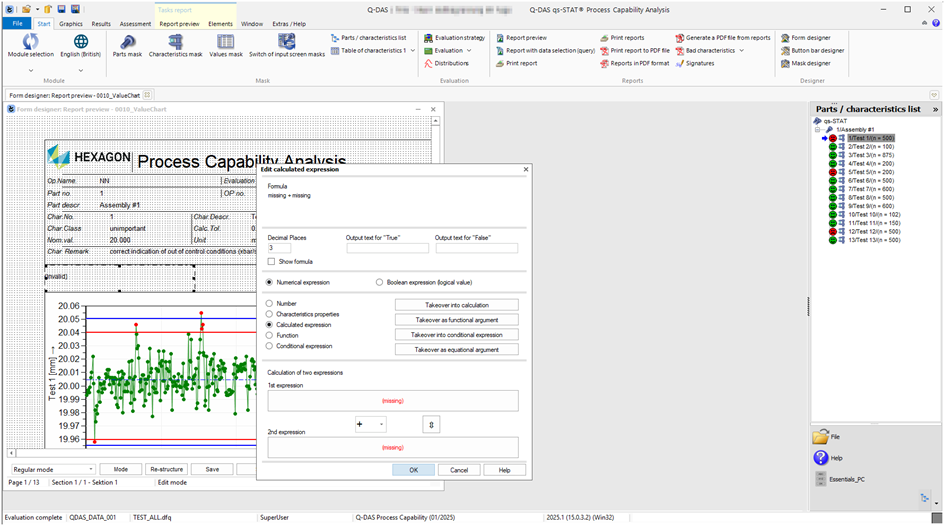
The following provides an overview of the necessary steps. Further details can be found via the provided links.
| 1 | Use the Form Designer (Q-FD) to create a new report or load an existing one. Link to: Q-FD - Basic handling |
| 2 | Add a new element by selecting "Calculated output" from the "Output field selection (listing)" dialogue. <Output field selection (listing)> | <Output combination fields> | <Calculated output> Link to: Q-FD - Basic handling |
| 3 | Load the "Edit calculate expression" dialogue from the context menu of the element and configure the required expression. Link to: General explanation of calculated expressions Link to: “Edit Calculated Expression” dialogue |