Working with Quality Control Charts (QCC) is the central element of SPC (Statistical Process Control). The following is a technical description of the QCC parameters. How to use them effectively, especially for SPC, needs to be covered in a training course.
Link to: Q-DAS Product Line - Training
The QCC calculation parameter can be configured for Analyse QCC and for SPC QCC. The parameter setting dialogue can be accessed from the ribbon bar.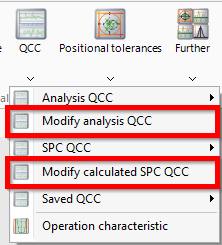
Another way to access the SPC QCC parameter setting dialogue is to click on the "Location" or "Variation" graphic within the "Characteristic Statistics -Design 6".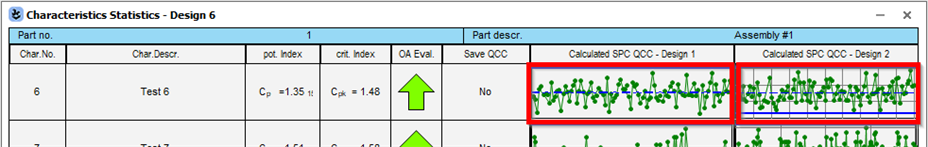
- Modify analysis QCC
In the first versions, when only Analysis QCC was available, "Modify analysis QCC" was used to store the QCC parameters to the dataset. With the implementation of SPC QCC, which uses the same K-fields to store a QCC to a dataset, "Modify analysis QCC" has lost its original meaning. Nowadays, evaluation strategies are configured so that the Analysis QCC uses the evaluation strategy parameters for calculation. This allows the QCC K-fields in the data set to be used for SPC. The use of "Modify analysis QCC" is therefore temporary. This means that the Analysis QCC is recalculated according to the evaluation strategy each time a dataset is opened or an evaluation is executed.
Nowadays, "Modify analysis QCC" can be used to visualise the effects of the calculations and, if necessary, to adopt the desired parameters for calculating the Analysis QCC in the evaluation strategy.
- Modify calculated SPC QCC
The SPC QCC calculation is carried out according to the "O-QIS" line of the evaluation strategy. It is used as a template for other QCCs such as Saved QCC or Online QCC. If there are other objectives to be achieved and the requirements differ from those defined in the evaluation strategy, parameters for a modified calculation can be defined here.Changing the QCC parameter is temporary. A Saved QCC needs to be created if the changed parameters are to be used.
When changing parameters, press the "Calculation" button to update the content in the QCC preview. 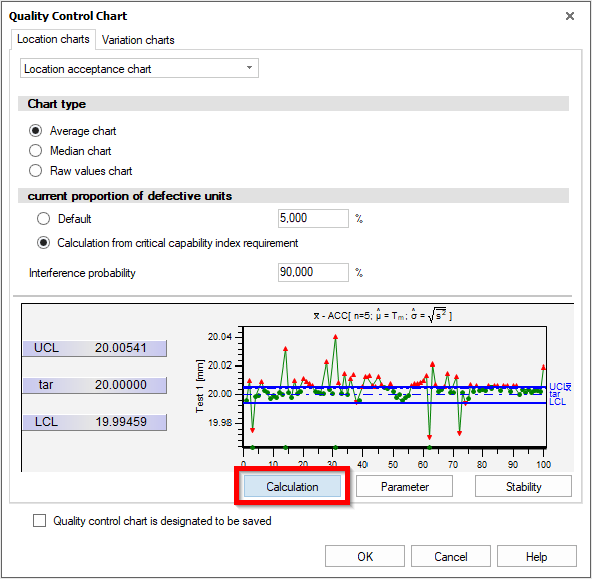
Table of Contents
Location Chart Parameters
For variable characteristics, location charts are basically divided into three types.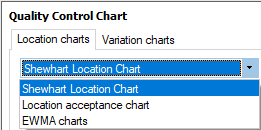
Table of Contents
Shewhart Location Chart
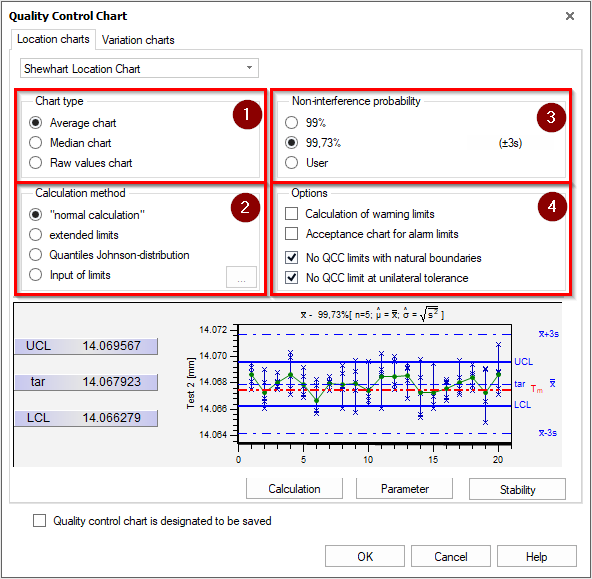
| 1 | Chart type (alarm trigger for O-QIS) |
| 2 | Calculation method (for QCC control limits) |
| 3 | Non-interference probability (confidence interval for QCC control limits) |
| 4 | Additional options |
1. Chart type (alarm trigger for O-QIS)
The chart type defines which specific statistic value of an individual subgroup triggers the alarm.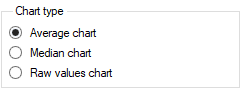
In other words, the following statistic values can be checked against the QCC control limits:
- the averages of the subgroups,
- the median values of the subgroups, or
- the range of the subgroups (the maximum and minimum value of a subgroup).
Note: In the case of the raw values chart, a fixed subgroup size is required. Incomplete subgroups must not be included in the analysis.
Accordingly, the selected chart type is the one displayed in the QCC.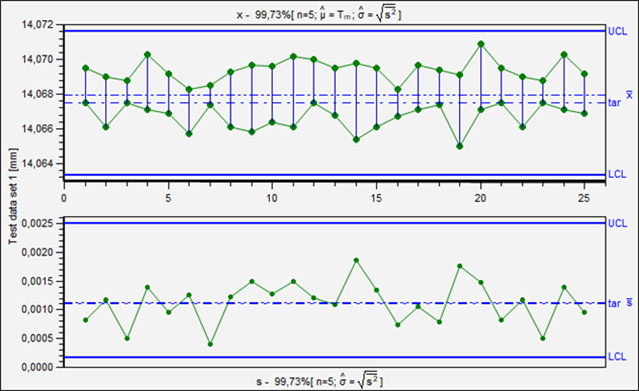
2. Calculation method (for QCC control limits)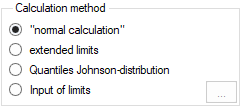
- "normal calculation"
The normal calculation follows the classic textbook calculations for single peak normally distributed processes.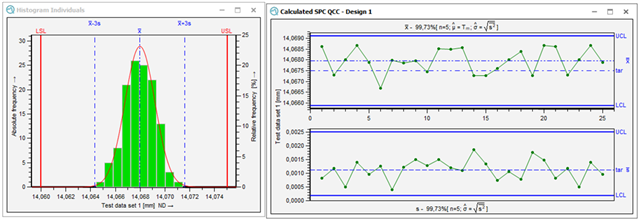
- Extended limits
The extended limits can be used when the process is not a single peak and has several variations.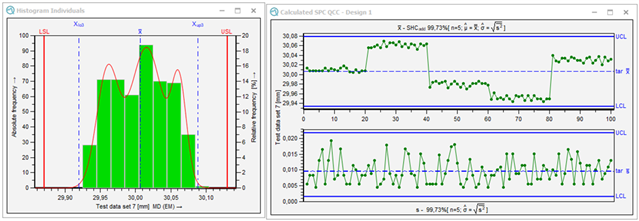
The coverage factor can then be defined in the "QCC parameter" dialogue, accessible via the "Parameter" button.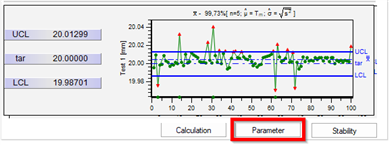
By default, the QCC parameter for extended limits is set to ANOVA.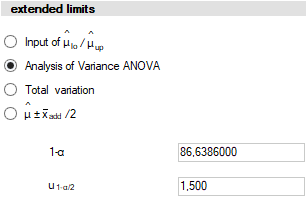
- Quantiles Johnson-distribution
For single peak but asymmetric distributions, the Quantiles Johnson-distribution is used.
- Input of limits
This function provides a dialogue for manual input of the various QCC limits. The number of input fields depends on the selected setting and whether QCC warning and alarm limits are to be calculated in addition to the QCC control limits.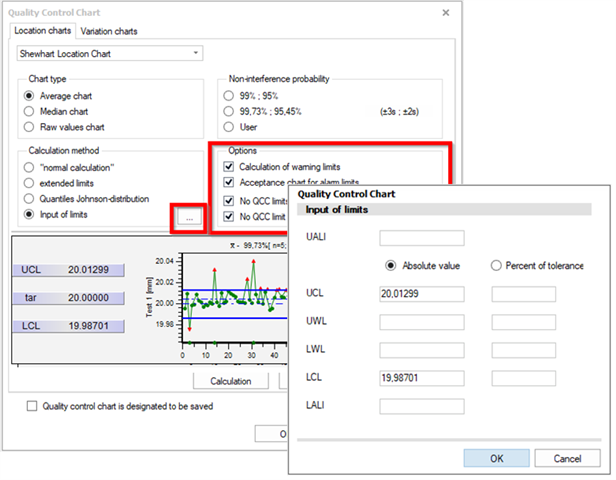
3. Non-interference probability (confidence interval for QCC control limits)
The parameters that are used to define the confidence interval for the calculation of the control limits are specified here.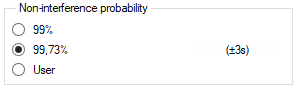
If the calculation of QCC warning limits is also active, both values are shown here.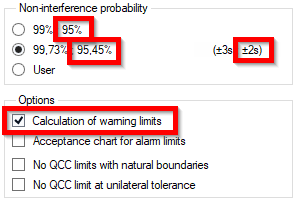
4. Additional options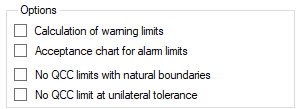
- Calculation of warning limits
If this option is enabled, the more restrictive QCC warning limits (UWL/LWL) are calculated and displayed in addition to the QCC control limits (UCL/LWL).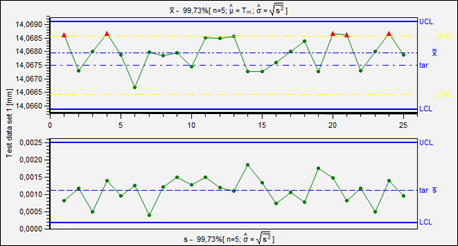
- Acceptance chart for alarm limits
As a third type of limits, the QCC location alarm limits (UALI/LALI) of the acceptance chart can also be activated. To set these limits, the chart must first be switched to "Acceptance Chart", saved, and then switched back to "Shewhart Location Chart".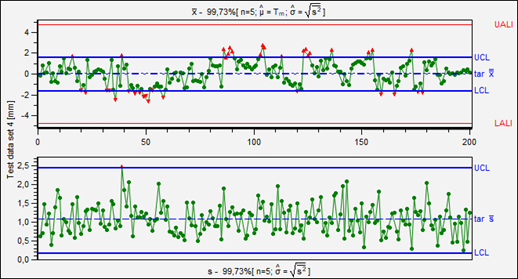
- No QCC limits with natural boundaries / No QCC limit at unilateral tolerance
These two options can be used to disable all QCC limits in the case of naturally limited processes or processes that are limited on one side (at the natural limits or at the non-existent limit).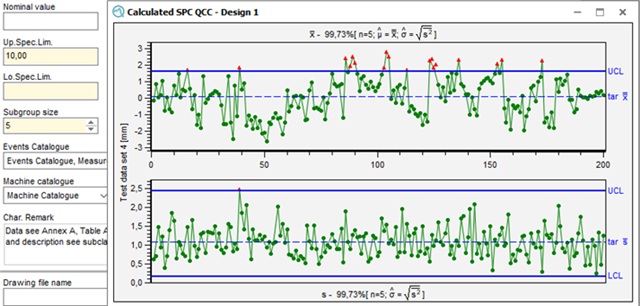
Exception: There are no upper and lower specification limits
The QCC control limits (UCL/LCL) are calculated even if no upper and lower specification limits are specified.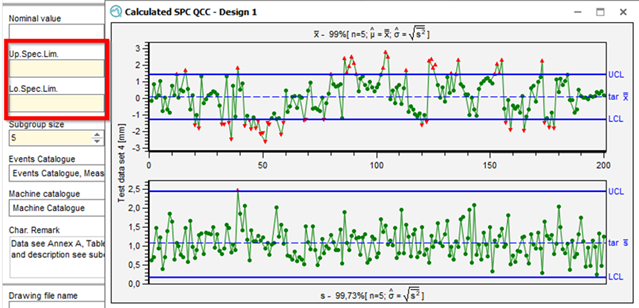
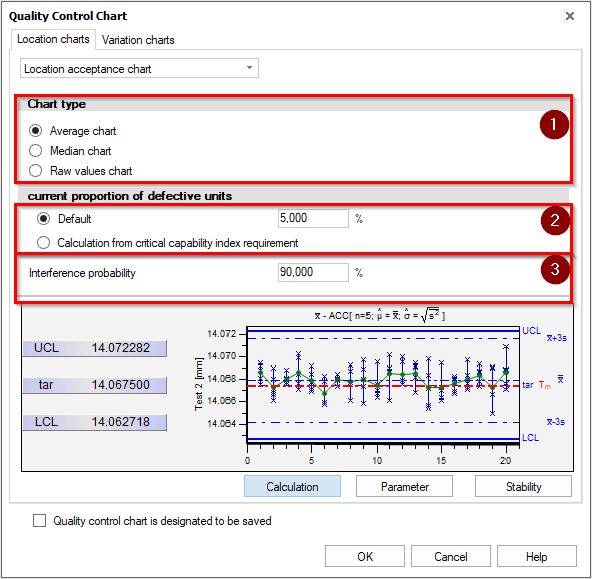
Location Acceptance Chart
| 1 | Chart type (alarm trigger for O-QIS) |
| 2 | Calculation method (for QCC control limits) |
| 3 | Non-interference probability (confidence interval for QCC control limits) |
1. Chart type (alarm trigger for O-QIS)
The chart type defines which specific statistic value of an individual subgroup triggers the alarm.
In other words, the following statistic values can be checked against the QCC control limits:
- the averages of the subgroups,
- the median values of the subgroups, or
- the range of the subgroups (the maximum and minimum value of a subgroup).
Note: In the case of the raw values chart, a fixed subgroup size is required. Incomplete subgroups must not be included in the analysis.
Accordingly, the selected chart type is the one displayed in the QCC.
The Location Acceptance Chart has basically the same meaning as the Shewhart Location Chart. The difference is in how the QCC location control limits (UCL/LCL) are calculated. Whereas the calculation of the Shewhart chart is based on the subgroups of measured values, the Acceptance Chart chart also takes the specification limits into account. The control limits for the Location Acceptance Chart are calculated "from the tolerance limits inwards".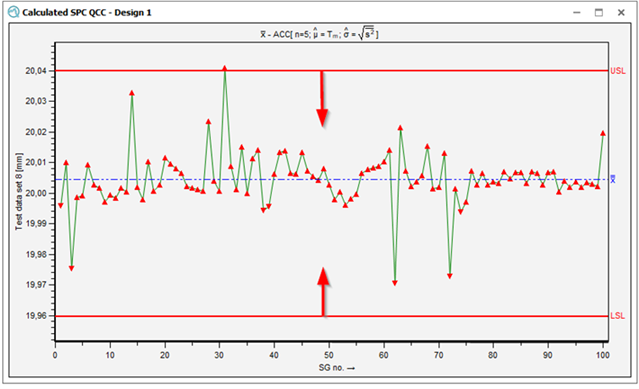
In the case of larger variations this type of calculation can result in the control limits overlapping. By "swapping" the upper and lower limits, all values are outside the QCC control limits. Furthermore, the tolerance middle, the middle of the specification limits, is outside both, the upper and lower QCC control limits.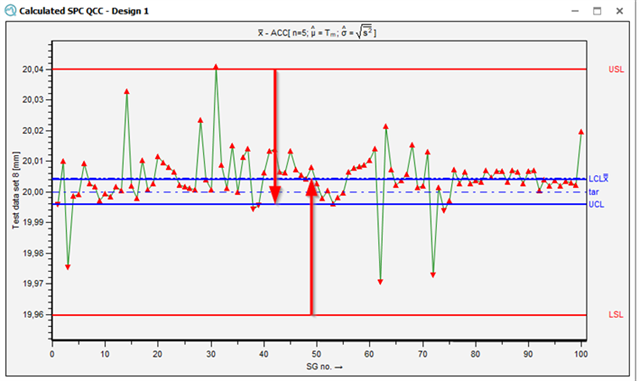
2./3. Current proportion of defective units (QCC control limits calculation)
The parameters used to calculate the control limits are specified here.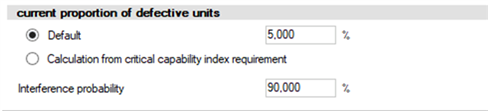
EWMA chart
Here is where the EWMA chart parameters can be defined. As the EWMA chart is currently of no importance in classic production, no description of the individual parameters is given here.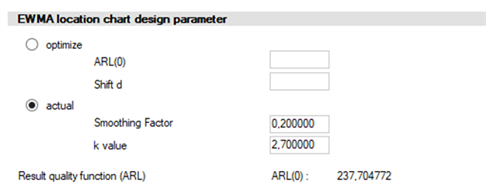
Variation Chart Parameters
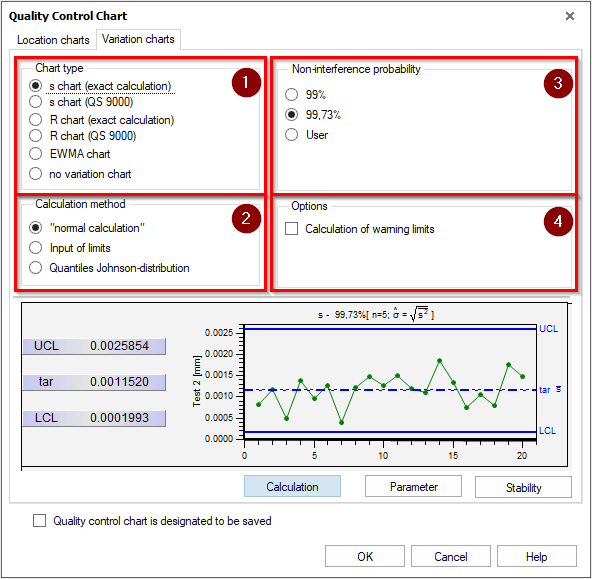
| 1 | Chart type (alarm trigger for O-QIS) |
| 2 | Calculation method (for QCC control limits) |
| 3 | Non-interference probability (confidence interval for QCC control limits) |
| 4 | Additional options |
1. Chart type (alarm trigger for O-QIS)
As with the Location Chart, this is where it is specified which statistic value of a single subgroup triggers the alarm. In other words, this statistical value is checked against the QCC control limits and displayed accordingly in the QCC.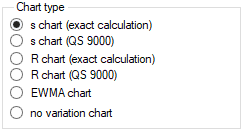
A brief technical explanation of the difference between the "exact calculation" and QS 9000 Variation charts:
- Variation charts with exact calculation also have a lower control limit of the Variation Chart.
- Variation charts according to QS 9000 only have an upper Control Limit of the Variation Chart.
Now the Variation Charts according to QS 9000 may seem to correspond to what is expected. After all, a variation that approaches 0 would be desirable.
However, there is the following to consider:
If there are increasing variations, i.e. a lower QCC control limit is moving further away from 0 and then a "lower control limit violation" is detected on the variation chart, this should be taken seriously. This may indicate an error in the measurement process.
Based on this philosophical approach, the alarms for control limit violations of the variation chart exist separately for the "upper" and "lower", so that the violation can be seen in the QCC, but is not alarmed. From a practical point of view, this is a common approach.
However, from a statistical point of view, the alarm for the violation of the lower control limit should also be kept.
2. Calculation Method (for QCC control limits)
The calculation methods are similar to those available for the Location Charts.
The option of manual input should also be considered critically for the variation charts.
- "normal calculation"
The normal calculation follows the classic textbook calculations for single peak normally distributed processes. - Input of limits
This function provides a dialogue for manual input of the various QCC limits. The number of input fields depends on the selected setting and whether QCC warning and alarm limits are to be calculated in addition to the QCC control limits.
- Quantiles Johnson-distribution
For single peak but asymmetric distributions, the Quantiles Johnson-distribution is used.
3. Non-interference probability (confidence interval for QCC control limits)
The parameters that are used to define the confidence interval for the calculation of the control limits are specified here.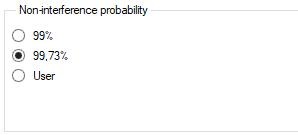
If the calculation of QCC warning limits is also active, both values are shown here.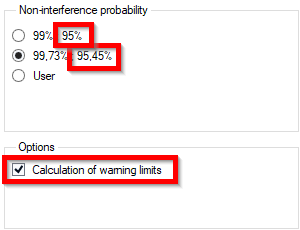
4. Additional Options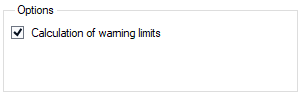
With warning limits enabled, the QCC warning limits are calculated and displayed in addition to the QCC control limits.
Parameters
The parameters determine which estimators are used to calculate the location and the variation control chart. The options available depend on the pre-selected chart and calculation method.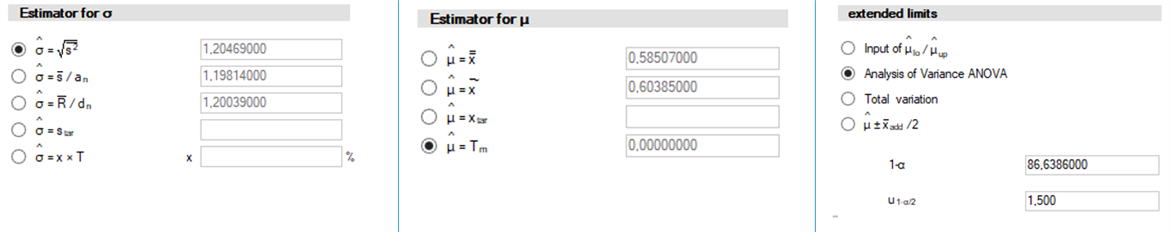
The "QCC parameter" dialogue is accessible via the "Parameter" button.
The "target values" are given by the estimators. In the case of estimator for process location (µ), the target value can be written at characteristic level in K-field "Target value" (K2100).In the case of the estimator for process variation (σ), the "target value" is configured for each characteristic using the QCC parameter dialogue.
Stability
The parameters used to visualize the stability of the process can be specified here.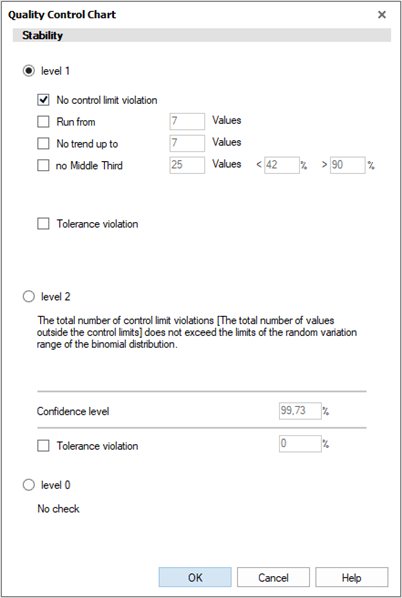
The QCC stability dialogue can be accessed via the evaluation strategy settings for the Analysis QCC and SPC QCC or when modifying the Analysis QCC or SPC QCC via the "Stability" button.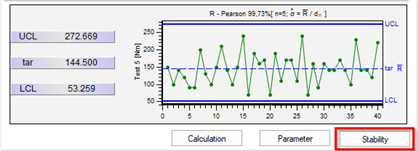
In order to explain the stability settings in this dialogue, it is first necessary to explain the different stability calculation settings in evaluation strategies and how the alarms are generated and used.
Check stability of a data set
The evaluation strategy settings determine the QCC stability statement.
Previous ISO standards required evaluation strategies to precisely define "stable" and "unstable" requirements. Therefore, in previous evaluation strategies, e.g. "Q-DAS 1 - Part", the stability check determined whether the data set was evaluated as stable or unstable. Additionally, it is checked whether the requirements of the tab "Target values QCC stable" or "Target values QCC unstable" are used, or whether the calculation method for stable or unstable is used. 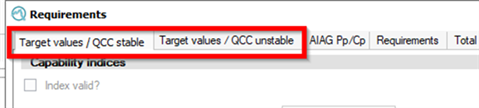
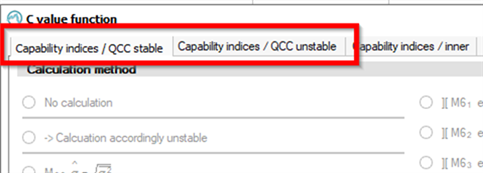
Newer evaluation strategies such as the "Q-DAS Process Capability (01/2020)" follow the newer ISO standards where the requirements are no longer relevant for the stability evaluation. In newer evaluation strategies, the paths of the distribution time models determine whether the data set is evaluated as stable (left marking) or unstable (right marking). 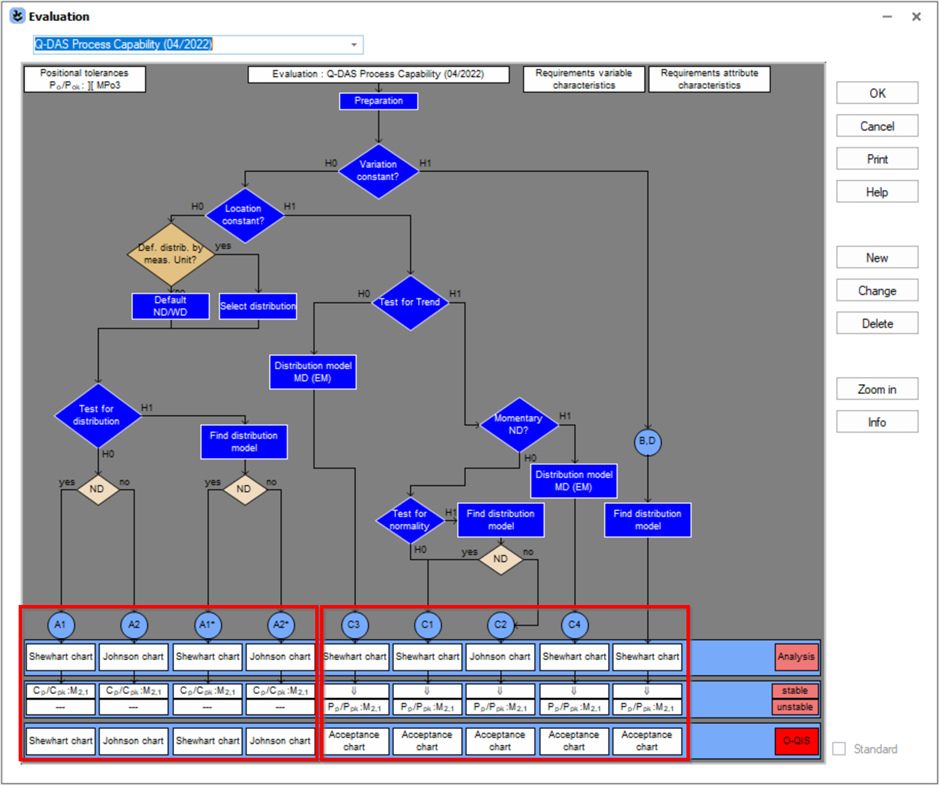
Alarm trigger
In order to trigger the various alarms for the QCC stability statement, the alarm conditions need to be defined in the evaluation strategy. Only the defined alarm conditions will trigger the corresponding alarms.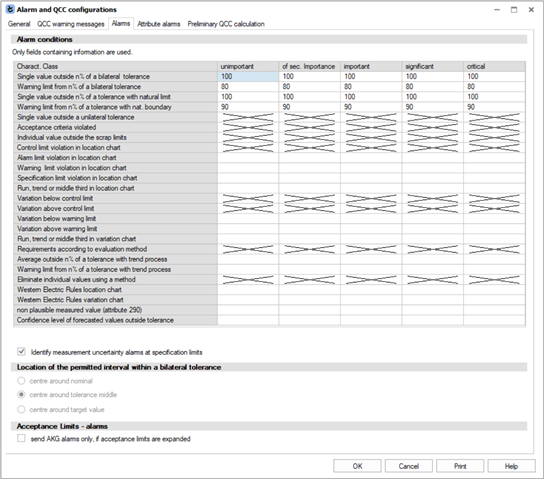
Alarm output
The Online QCC, which is available in the O-QIS module, is used for follow-up escalations such as alarm/email/test plan lock. The O-QIS modules use the evaluation strategy settings to check and output single value alarms. But in case of process trend the O-QIS modules needs besides the defined alarm conditions also the defined QCC conditions for a process trend.
QCC Stability - Display (process trend)
To obtain a QCC stability statement the settings from the QCC stability dialogue are used. In principle, the QCC stability settings are used to visualize the QCC stability in the QCC graphics.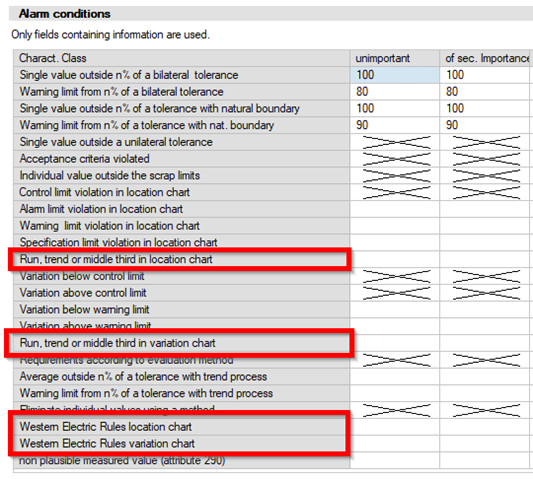
Run, Trend, Middle Third and WER are displayed in the QCC even without defined alarm conditions and have their own icons.
Enabling QCC visualisation should be considered carefully. As in the following case, it can easily overwhelm the user.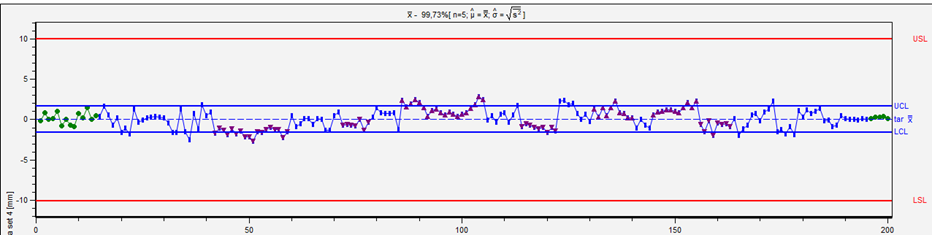
QCC Stability - Alarm (process trend)
There are two scenarios to indicate a process trend alarm.
- With the QCC stability statement settings saved in a dataset (Saved QCC) and enabled process trend alarms.
- Or, if there is no QCC in the dataset, a preliminary calculation is performed for Online QCC and process trend alarms are enabled.
QCC Stability Settings
| Level 1 | The “No control limit violations” option does not mean that alarms will only be triggered if the option is set. The alarm for control limit violations is independent of the stability setting. The Run/Trend/Middle Third options can be set as stability criteria. In strategies that define stability based on distribution time models, this has only an indicating or alarming character. In the case of a normal distribution, a Shewhart Chart and a non-intervention probability of 99.73%, the WER (Western Electric Rules) are also available. The application of these outdated stability criteria for alarming should be tested in the project. These rules are from a bygone era and should be carefully reviewed with today's measurement technology and recording frequency, as the potential for false alarms is multiplied by the number of options enabled. |
| Level 2 | The number of control limit violations is compared to a permitted number of control limit violations. If this number is exceeded, the data set is considered unstable. This level is no longer relevant in the evaluation strategies where the distribution time models determine the stability. |
| Level 0 | None of the stability checks are performed. |
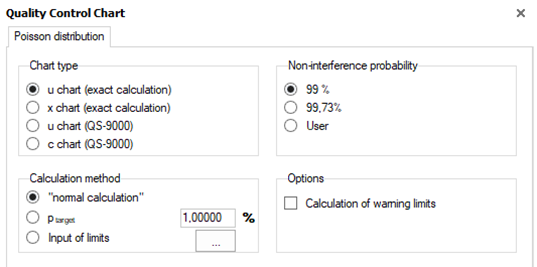
Binomial and Poisson Distribution (Attributive Characteristics)
When creating a QCC for attributive characteristics, the distribution types Binomial and Poisson are available. The distribution type is defined by selecting the content of the K-field "Distribution" (K2011).
However, the use of the Poisson distribution for attributive characteristics needs to be discussed in a training course.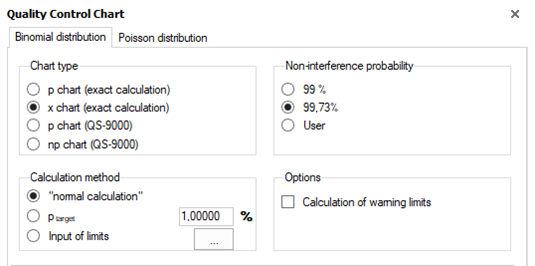
Poisson Distribution (Error Log Sheet)
When creating a QCC for Error Log Sheet, the distribution type Poisson is available. The handling of the Poisson chart for ELS has to be discussed in a training course.