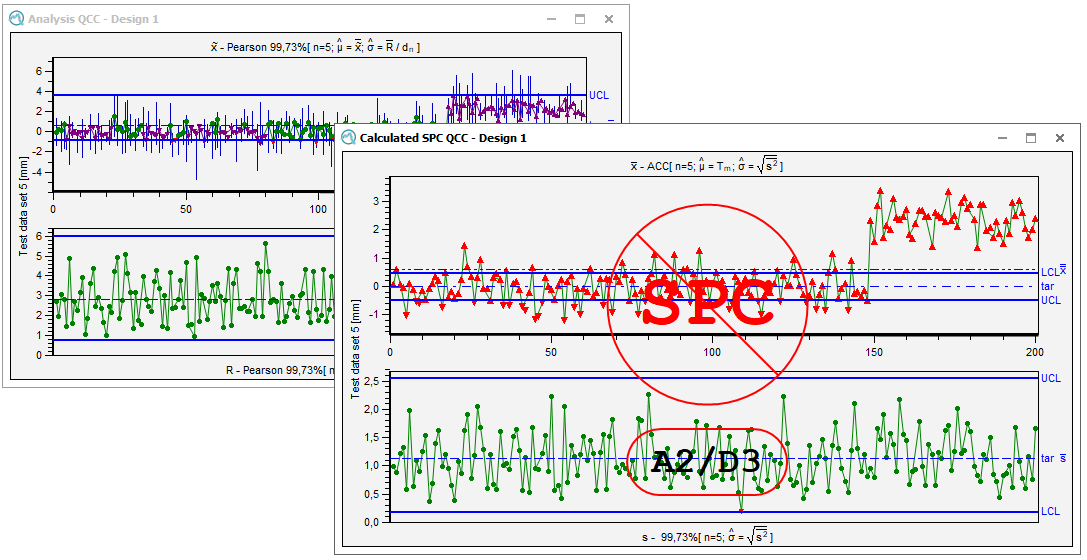
Quality control charts (QCC) help to visualize the process behaviour in terms of process location and variation. The QCC plots statistics (e.g. number of defects per unit, averages, median values, etc.) over time and compares them to limits (control and sometimes even warning limits) in order to evaluate location and variation. These comparisons lead to a statement about the stability of the process. Top priority is to detect significant changes and to find out how these changes affect the process, If, according to the respective analyses, a process is assessed to be stable, it will be important to maintain or even improve the achieved situation.

 |
Link to: QCC Graphics This topic covers the special graphics settings that apply to QCC graphics as well as the different QCC layouts. |
 |
Link to: Operation Characteristic QCC The subject of this topic is the graphical representation of the Operating Characteristic (OC) function for Quality Control Charts (QCC). |
| Link to: Available QCC Types The purpose of the various QCCs is briefly explained in this topic. |
|
| Link to: Handling of Saved QCC for SPC This topic describes how to create or remove Saved QCCs. |
|
| Link to: QCC Parameters Technical description of the QCC parameters that are available in the Q-DAS applications. |
|
| Link to: QCC Suggested Working Method There are a number of considerations to be made before embarking on an SPC system. This topic is in no way a substitute for the workshop itself. It is intended to give an idea of the issues that need to be considered and how these issues can be put into practice. |
|
| See the How to "SPC" series for more tips on SPC |
