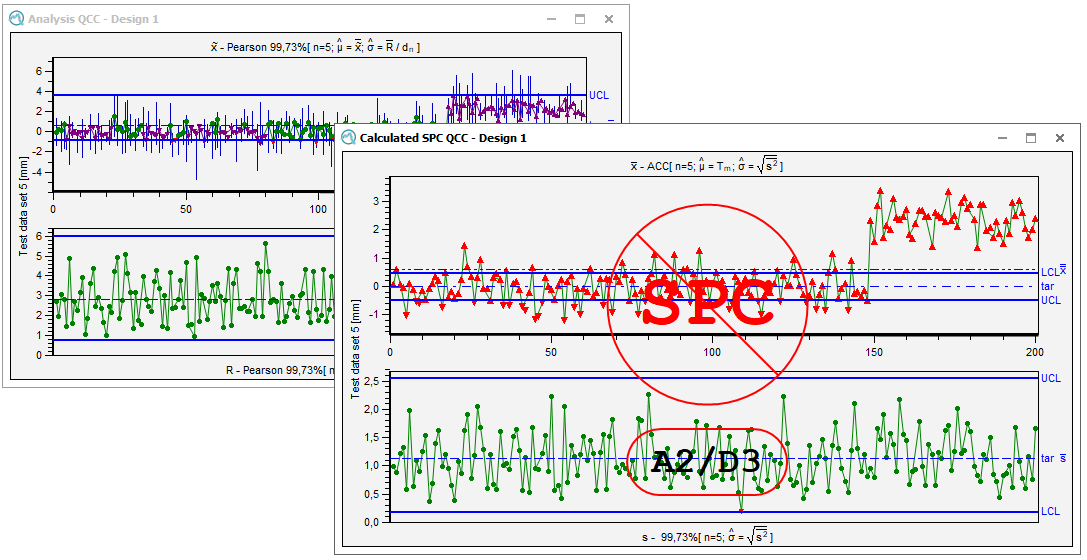
Quality control charts (QCC) help to visualize the process behaviour in terms of process location and variation. The QCC plots statistics (e.g. number of defects per unit, averages, median values, etc.) over time and compares them to limits (control and sometimes even warning limits) in order to evaluate location and variation. These comparisons lead to a statement about the stability of the process. Top priority is to detect significant changes and to find out how these changes affect the process, If, according to the respective analyses, a process is assessed to be stable, it will be important to maintain or even improve the achieved situation.

| QCC This documentation describes the special graphically settings that apply only to this graphic. |
English:PDF | German:PDF |
| Save QCC This document describes the different types of QCCs, how to store them and the interaction between qs-STAT and O-QIS. |
English:PDF | German:PDF |
|
Operation Characteristics QCC
This document describes the operation characteristic (OC) options and planning that can be used to define the strength of the quality control chart and the information it contains. |
English:PDF | German:PDF |
|
General configuration
Options for general graphics configuration are stored in the "Graphical settings" tab. Link to Graphical Settings Tab |
||
| Working with the graphics The "Part / characteristic" tab provides options and functions for working with graphics. These include various data selection options for display and evaluation, as well as various configuration options for the displaying multiple characteristics. Link to Part / Characteristic Tab
|


